

1. index 배경화면 변경

- CSS 사진 경로 설정 주의
- CSS의 background-size 속성을 cover로 하면 화면 비율에 꽉 차고 반응형에 적합하다.
2. 판다스 Groupby 데이터 출력
from tokenize import group
from bs4 import BeautifulSoup
import requests
import pandas as pd
import time
from math import ceil

def show_valueList(list_num, typeList):

    list_num = int(list_num)
    url = "https://www.transfermarkt.com/"

    headers = {'User-Agent' : "Mozilla/5.0 (Windows NT 10.0; Win64; x64) AppleWebKit/537.36 (KHTML, like Gecko) Chrome/103.0.0.0 Safari/537.36"}
    player_list=[]

    for i in range(1, ceil(list_num/25)+1):
        url = f"https://www.transfermarkt.com/spieler-statistik/wertvollstespieler/marktwertetop?ajax=yw1&page={i}"

        r = requests.get(url, headers=headers)

        soup = BeautifulSoup(r.text, 'html.parser')
        player_info = soup.find_all('tr', class_ = ['odd','even'])

        for info in player_info:
            player = info.find_all("td")
            number = player[0].text
            name = player[3].text
            position = player[4].text
            age = player[5].text
            nation = player[6].img['alt']
            team = player[7].img['alt']
            value = player[8].text.strip()
            player_list.append([number, name, position, age, nation, team, value])

        time.sleep(1)

    df = pd.DataFrame(player_list,
        columns=['#', 'Player', 'Position', 'Age', 'Nat.', 'Club', 'Value'])
    df['Value'] = df['Value'].str.replace('€','')
    df['Value'] = df['Value'].str.replace('m','').astype('float')

    if not typeList:
        df.drop(columns=['Value'], inplace=True)
    else:
        for data in typeList:
            if data == "USD":
                df['Value($)'] = df['Value']*1.01
                df['Value($)'] = df['Value($)'].round(3)
                df['Value($)'] = df['Value($)'].astype(str)+'M'
            elif data == "EUR":
                df['Value(€)'] = df['Value']
                df['Value(€)'] = df['Value(€)'].round(3)
                df['Value(€)'] = df['Value(€)'].astype(str)+'M'
            elif data == "KRW":
                df['Value(₩)'] = df['Value']*13
                df['Value(₩)'] = df['Value(₩)'].round(3)
                df['Value(₩)'] = df['Value(₩)'].astype(str)+'억'
        df.drop(columns=['Value'], inplace=True)

    df = df[0:list_num]
    # 데이터프레임 변환
    group_data = df.groupby('Nat.').size().sort_values(ascending=False)
    group_data = group_data.reset_index()
    group_data.rename(columns={0:'Count'}, inplace=True)
    group_data.rename(columns={'Nat.':'Nation'}, inplace=True)

    # 데이터프레임 합치기
    result = pd.concat([df,group_data], axis=1)
    result.fillna(0, inplace=True)
    result = result.astype({'Count':'int'})
    # Nan -> 0 제거
    result.loc[result['Count'] == 0, 'Count'] = ''
    result.loc[result['Nation'] == 0, 'Nation'] = ''

    return result


if __name__ == "__main__":
    show_valueList(10, typeList=[])
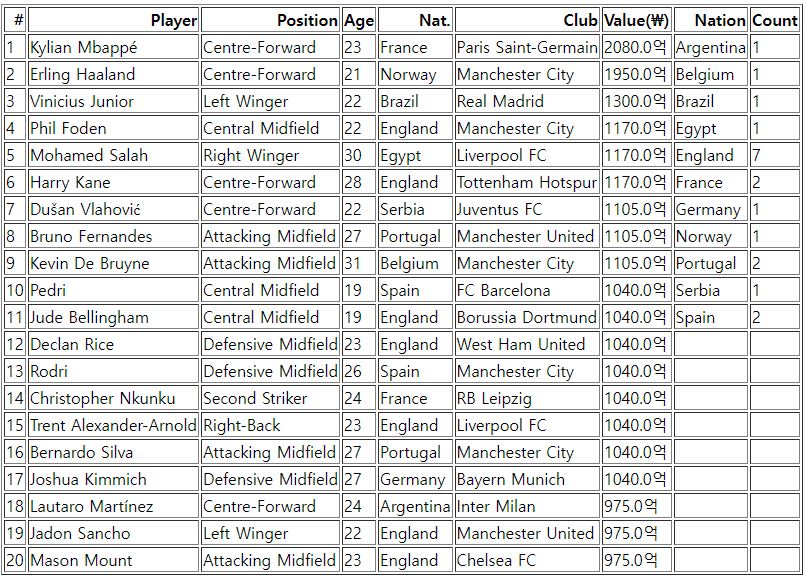
- Groupby size()로 리스트에 속한 나라별 랭킹을 Dataframe으로 변환한 뒤 합쳐서 출력한다.
- NaN 데이터는 0 (Int 형)으로 대체한 뒤 조건문을 통해 공백으로 바꾼다.
3. 문제 해결
- 나라별 빈도 수를 같이 출력하고 싶어서 따로 표를 만들었으나 두 데이터프레임의 행과 열이 달라서 병합하는 데 어려움이 있었다. 형변환과 데이터 대체의 순서가 올바르지 않으면 에러를 발생하였다. 그리고 특정 행과 열만 값을 처리해야 하기 때문에 코드가 복잡해질 수 있었다.
- 먼저 특정 열을 정수형으로 변환한 뒤 결측값을 다 0으로 만들고 그 0에 해당하는 행과 열(결측값, NaN)만 ' ' (공백)으로 만드는 코드를 작성하여 해결하였다. 그 결과, 표의 가독성도 훨씬 좋아졌다.
- 이 과정에서 코드가 길어졌기 때문에 프로젝트가 마무리되는 시점에서 리팩토링을 해야할 것 같다.
'사이드 프로젝트 > 축구선수 몸값 웹 크롤링' 카테고리의 다른 글
| 축구선수 몸값 분석 웹 크롤링 (9) - 결과표 html 템플릿 만들기 (0) | 2022.07.18 |
|---|---|
| 축구선수 몸값 분석 웹 크롤링 (8) - 선택 항목 추가 및 실행시간 단축 (0) | 2022.07.14 |
| 축구선수 몸값 분석 웹 크롤링 (6) - Bootstrap으로 html 꾸미기 (1) | 2022.07.12 |
| 축구선수 몸값 분석 웹 크롤링 (5) - 선택조건 체크박스 추가 및 데이터 처리 (0) | 2022.07.11 |
| 축구선수 몸값 분석 웹 크롤링 (4) - 입력 범위 수정 및 Index 열 삭제 (0) | 2022.07.08 |